ENEnglish
 LTLietuviškai
 DEDeutsch
 FRFrançais
 RUРусский
 ESEspañol
 PLPolski
 ITItaliano
 UKУкраїнська
 CSČeština
 PTPortuguês
 JA日本語
JA日本語 LVLatviešu valoda
 ETEesti
 HUMagyar
 IDBahasa Indonesia
 TRTürkçe
 HIहिन्दी
 ELΕλληνικά
 ARالعربية
 THไทย
THไทย VITiếng Việt
 RORomână
 MSBahasa Melayu
 BNবাংলা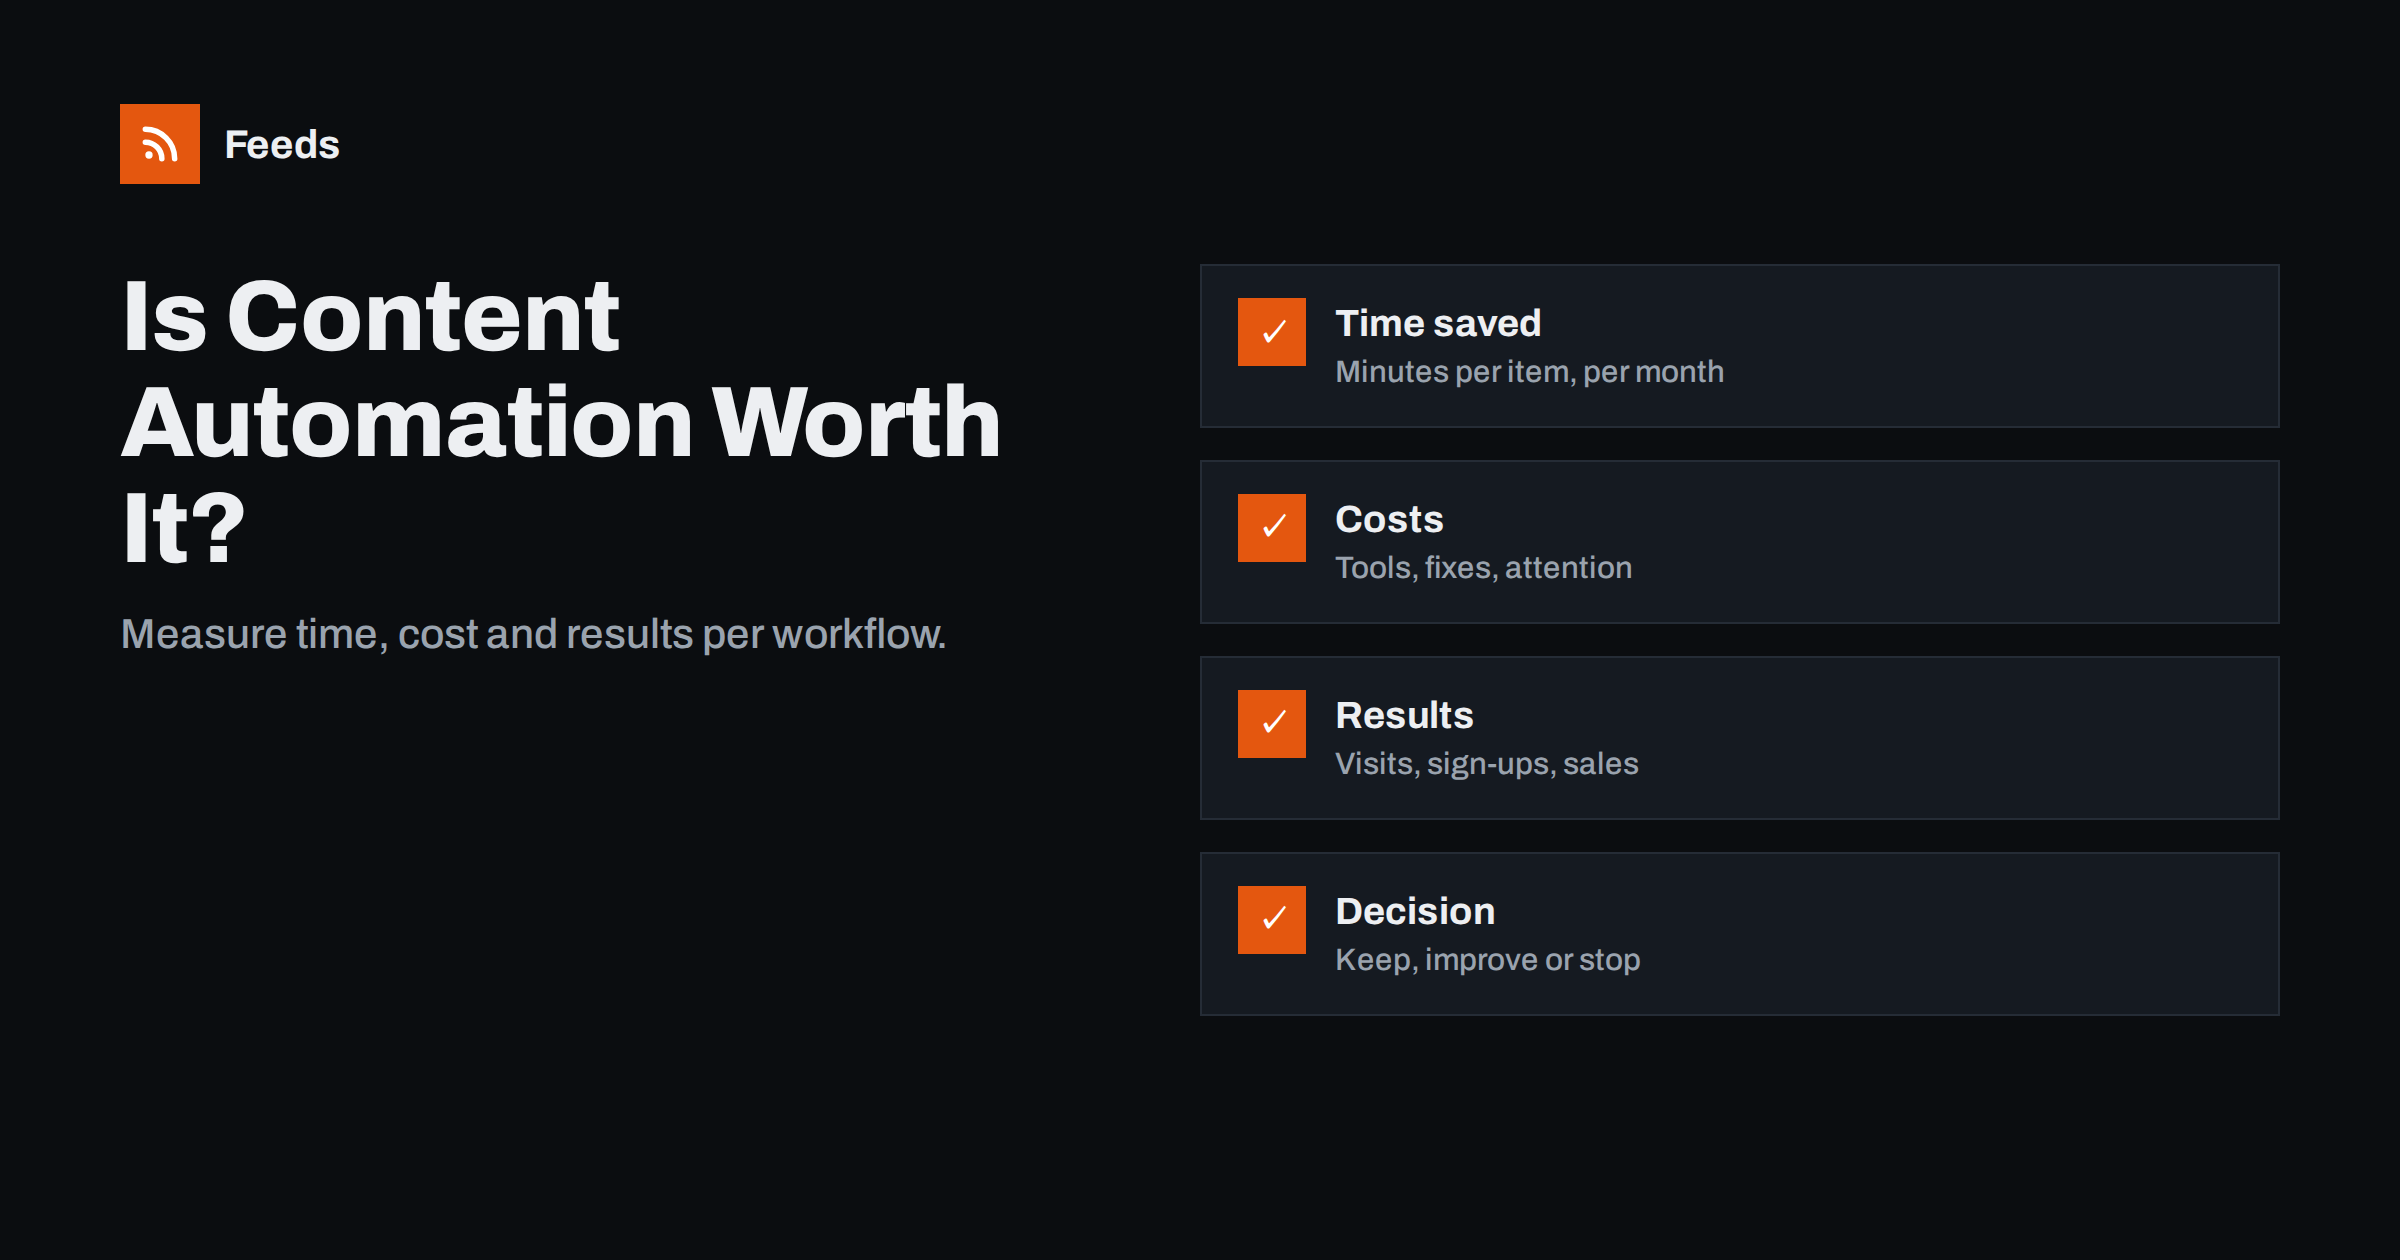
Short answer: To measure whether content automation is worth it, look at each workflow separately and compare three things: the time it saves (manual minutes per item multiplied by items per month), what it costs (tool fees plus time spent fixing and checking it) and what it brings (visits, sign-ups, sales or team time saved, measured with UTM parameters and platform analytics). Keep workflows where results clearly exceed costs, improve those that are close, and switch off those that bring nothing.
Why “is automation worth it?” is the wrong question
Asked in general, the question has no useful answer. Some automations save hours every week and bring steady traffic; others quietly cost money and attention while delivering almost nothing. Averaging them hides both.
The useful question is per workflow: is this specific automation, from this source to this destination, worth what it costs? Once you frame it that way, measurement becomes a small, repeatable exercise that can be done in an hour each quarter.
It also helps to separate two kinds of value. Some workflows are about efficiency: they replace work someone would otherwise do by hand, such as posting every new article to four networks. Others are about reach: they create exposure that would not exist without them, such as a weekly digest nobody had time to write. Efficiency is measured in time; reach is measured in results.
Step 1: list your workflows
Start with an inventory. For each workflow, note:
- Source (which feed) and destination (which channel or tool).
- Tool used and the plan it runs on.
- Approximate number of items per month.
- Who owns it.
- When it was created and last checked.
Many teams discover workflows during this step that nobody remembered: an old channel still receiving posts, a newsletter still sending to an outdated list, a trial account still running. Those are the first candidates for cleanup, and the inventory itself often pays for the exercise.
Step 2: estimate the time saved
For efficiency workflows, the calculation is simple:
Time saved per month = minutes per item if done manually × items per month.
Be realistic about the manual time. Posting an article to one network by hand, including finding the link, writing a line and checking the preview, typically takes a few minutes. Assembling a digest email by hand can take much longer. Multiply by the number of items and destinations.
Then ask the honest follow-up: would anyone actually do this work by hand if the automation stopped? If the answer is “no, we would just stop posting there”, the workflow is not saving time; it is creating reach. Measure it by results instead.
Step 3: add up the costs
Costs have three parts, and the last two are often forgotten.
- Tool fees: the share of each subscription attributable to the workflow. For tools billed per task or operation, estimate from the item count.
- Maintenance time: fixing broken connections, adjusting filters, handling duplicates, checking output. Even a well-built workflow needs occasional attention.
- Attention costs: the cost of posting things that are not quite right, such as followers muting a noisy channel or subscribers unsubscribing from a too-frequent digest. These are harder to quantify, but they show up in engagement trends and unsubscribe rates.
Step 4: measure the results
For reach workflows, results matter more than time. Measure at the destination and on your website.
On the website
Add consistent UTM parameters to every automated link, so your analytics tool attributes visits correctly. Then look at sessions, engagement and conversions per source and campaign. Conversions can be anything that matters to your business: contact form submissions, sign-ups, downloads, purchases.
At the destination
Social networks show impressions, clicks and reactions per post. Email platforms show opens, clicks and unsubscribes per send. Chat tools show less, but reactions, replies and whether people still read the channel give useful signals.
Internal workflows
For team news channels and digests, the result is informed people rather than traffic. Ask users directly once or twice a year: do you read it, what would you miss if it stopped, what should change? A two-question poll in the channel is enough.
Step 5: decide per workflow
| Situation | Decision |
|---|---|
| Saves clear time and has low maintenance | Keep; check quarterly |
| Brings measurable visits or conversions above its cost | Keep; look for improvements |
| Brings some results but costs a lot of maintenance | Fix the root cause, often the source feed |
| Brings almost nothing and nobody would miss it | Switch off |
| Brings nothing but the channel matters strategically | Improve content and templates before judging again |
When results and costs are close, look at the cheapest improvement first. Often a better template, a tighter filter or a different posting time changes the picture more than a new tool would. Give the change a full quarter before deciding again.
Switching off is a legitimate outcome. A workflow that runs without results still costs money, maintenance and some of your audience’s attention.
A worked example with round numbers
Consider a small consultancy with four automations, reviewed at the end of a quarter. The numbers below are illustrative, to show the method rather than typical results.
- Blog to LinkedIn page. About ten articles a month. Posting by hand would take roughly five minutes each, so the workflow saves close to an hour a month. Analytics show a steady stream of visits tagged with the LinkedIn campaign, and a couple of contact form submissions over the quarter came from those visits. Maintenance: one reconnection. Decision: keep.
- Blog to X. Same ten articles. Nobody would post them by hand if the workflow stopped, so it is a reach workflow. Visits from the X campaign are very low, and the tool charges extra for X. Decision: switch off and reinvest the fee.
- Weekly client digest. Built from the blog and three curated industry sources. Assembling it by hand would take an hour a week. Click rates are healthy, replies from clients are frequent and positive. Maintenance: filters adjusted twice. Decision: keep and improve the introduction.
- Industry news channel for the team. Twenty sources into a chat channel. A quick poll shows that half the team muted it. The feed brings dozens of items a day. Decision: fix, by tightening keyword filters, merging sources with duplicates removed and switching to a daily summary.
The whole review takes about an hour and changes something in three of the four workflows. That is typical: the value of measurement lies less in the numbers themselves than in the decisions they prompt.
Write down the decisions and the date, and look at the same workflows again next quarter. After two or three rounds, you will have a clear picture of which automations genuinely earn their place.
Common measurement pitfalls
- Judging too early. Give workflows a few months; weekly numbers fluctuate a lot.
- Missing UTM tags make automated traffic appear as direct or generic referral traffic, understating results.
- Counting impressions as results. Impressions show exposure, not interest. Clicks, replies and conversions matter more.
- Ignoring the source. A workflow may look ineffective because its source content is weak, not because automation fails.
- Comparing different periods without accounting for seasonality or campaigns.
Lowering costs at the source
Maintenance time is often the biggest hidden cost, and much of it comes from the source feeds: sites without RSS that need workarounds, noisy feeds that need complex filters, overlapping sources that cause duplicates, and pages whose layout changes break scrapers.
Feeds addresses these at the source. It creates RSS feeds from pages that list articles, merges several sources, keeps or drops items by keyword and removes duplicates automatically. Feeds refresh on their own, and paid plans alert you when a feed stops finding items. Cleaner inputs mean simpler workflows, fewer operations in task-billed tools and less time spent fixing things. The pricing page shows what each plan includes, so you can put the cost into the same calculation.
Related reading
- How to Track Traffic from Automated Posts with UTM Tags
- What Is Content Automation? A Practical Guide for Small Teams
- 12 Content Automation Mistakes and How to Avoid Them
- Content Automation for Agencies Managing Many Clients
The bottom line
Measure content automation workflow by workflow. List them, estimate the time saved, add up tool fees and maintenance, and measure results with UTM parameters and platform analytics. Keep what clearly pays off, fix what is close, and switch off what nobody would miss. An hour each quarter is enough to keep automation working for you rather than the other way round.
BUJ
What is a good way to measure time saved by automation?
Multiply the minutes each item would take manually by the number of items per month and destinations. Then check honestly whether anyone would do that work by hand if the automation stopped.
How do I measure traffic from automated posts?
Add consistent UTM parameters to every automated link and review sessions, engagement and conversions by source and campaign in your analytics tool.
How often should automations be evaluated?
A quarterly review is enough for most small teams. Weekly numbers fluctuate too much to judge a workflow reliably.
When should I switch off an automation?
When it brings little measurable result, nobody would miss it and it still costs fees, maintenance or audience attention. Switching off unproductive workflows is a normal outcome of review.
What hidden costs does content automation have?
Maintenance time for broken connections and filters, and attention costs such as unfollows or unsubscribes caused by noisy or poorly formatted automated content.
Can internal automations be measured too?
Yes, but by different signals. For team news channels and internal digests, ask users whether they read and value them, and watch whether people mute the channel. Informed colleagues are the result, not website traffic.