ENEnglish
 LTLietuviškai
 DEDeutsch
 FRFrançais
 RUРусский
 ESEspañol
 PLPolski
 ITItaliano
 UKУкраїнська
 CSČeština
 PTPortuguês
 JA日本語
JA日本語 LVLatviešu valoda
 ETEesti
 HUMagyar
 IDBahasa Indonesia
 TRTürkçe
 HIहिन्दी
 ELΕλληνικά
 ARالعربية
 THไทย
THไทย VITiếng Việt
 RORomână
 MSBahasa Melayu
 BNবাংলা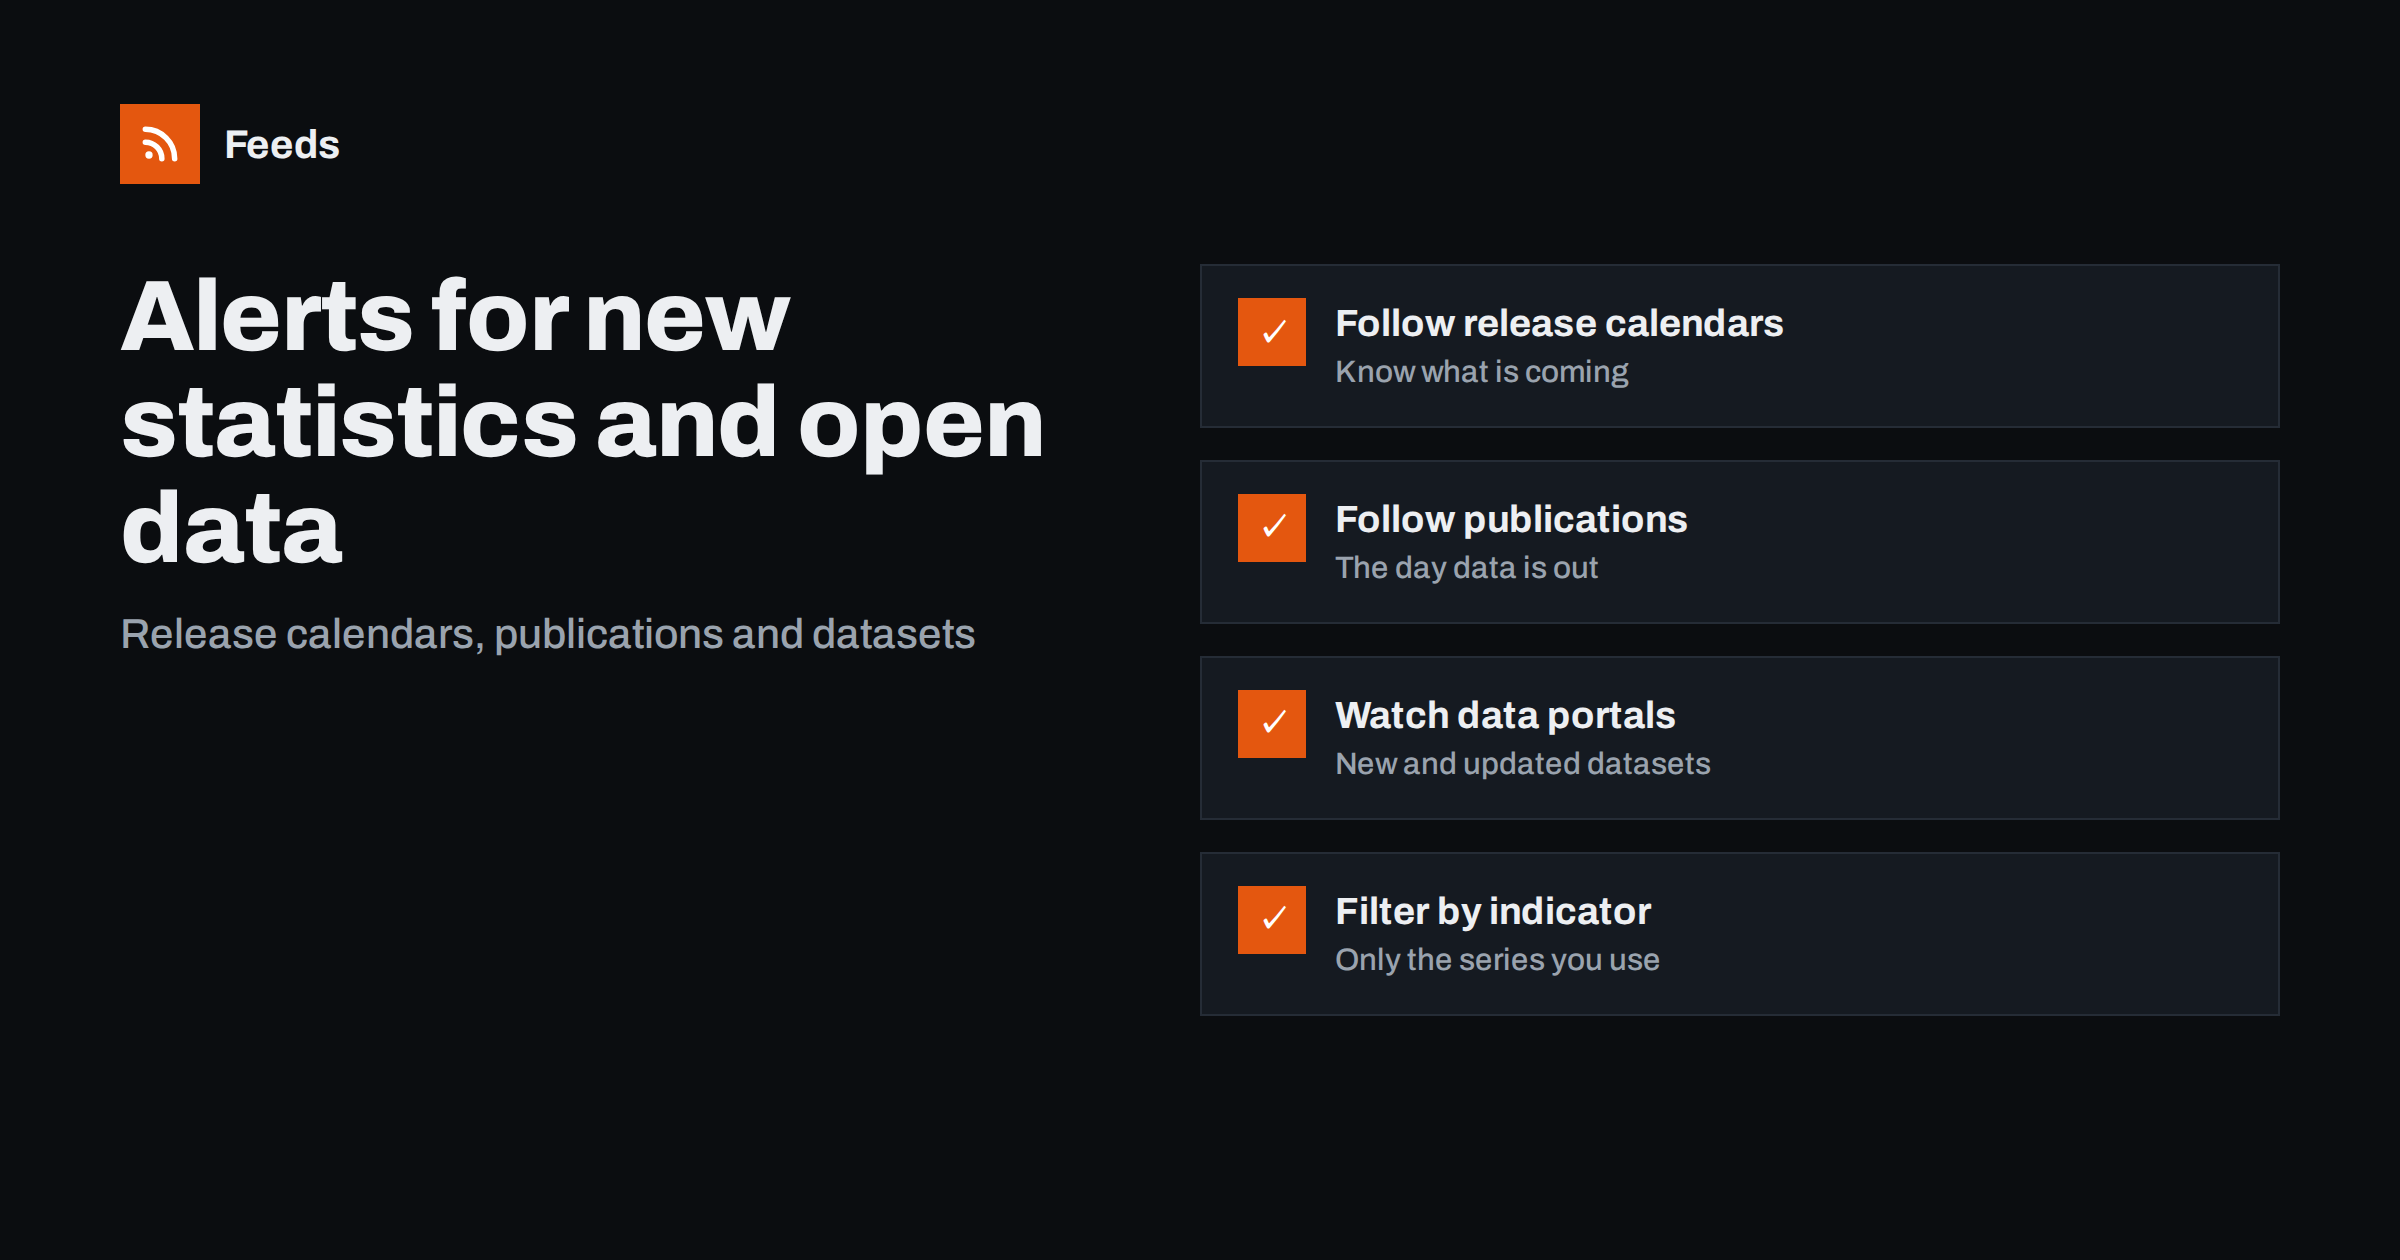
Short answer: Follow three kinds of pages for each statistics source: the release calendar, which tells you what is coming; the publications or news page, which announces each release; and, for open data portals, the list of new or updated datasets. Many statistics offices and data portals offer RSS for some of these; create feeds from the rest. Merge them, filter for the indicators and topics you use, and plan your analysis around scheduled release dates.
Analysts, economists, journalists, researchers, consultants and many businesses depend on official statistics: inflation, employment, trade, housing, population, sector output and countless specialized series. Open data portals add datasets from public bodies, cities and agencies. The information is public and often free, but finding out promptly that a new release or dataset is available still means checking several websites. A feed-based setup makes new data come to you.
Speed matters more than it might seem. Journalists compete to report new figures first, analysts want to update forecasts before clients ask, and businesses that use official data in pricing or planning benefit from acting on the latest numbers. Even where speed is not critical, a reliable way of knowing that new data exists prevents the common situation where a report uses last quarter’s figures because nobody noticed the update.
Why statistics are well suited to feeds
Official statistics follow a predictable rhythm. Most national statistics offices publish release calendars in advance and announce each release with a short article or bulletin, often at a fixed time of day. That structure makes them easy to follow: calendars tell you when to expect data, and publication lists tell you when it has arrived.
Open data portals are less predictable. Datasets are added and updated irregularly by many publishers, and the portal’s front page rarely shows what is new in your field. Feeds of new or updated datasets, where portals provide them, or generated feeds from filtered dataset lists, fill that gap.
Step 1: Map your data sources
| Source | Pages to follow | Typical feed options |
|---|---|---|
| National statistics office | Release calendar, latest releases, topic pages | Often RSS per topic or for all releases |
| Central bank | Statistical releases, publications | Often RSS |
| Regional or international statistics bodies | News releases, database updates | Varies |
| Ministries and agencies | Statistics or research sections | Rarely |
| Open data portals | New and updated datasets, filtered by publisher or topic | Some portals offer dataset feeds |
| City and regional portals | Dataset lists, news | Varies widely |
| Industry associations | Market data releases | Rarely |
List the specific statistical series and datasets you actually use, then find where each is published. It is common to depend on a handful of series from five or six different bodies. Writing the list down also reveals dependencies you may not have noticed, such as a dashboard that silently relies on a dataset from a small agency with no announcements at all.
Step 2: Follow release calendars
A release calendar is a list of upcoming publications with dates. Following it as a feed tells you when new releases are scheduled, so you can plan analysis, reports or articles around them. Some calendars have feeds; others are list pages that can be turned into feeds. Filter the calendar feed for the series you use; national calendars list hundreds of releases, most of which will never matter to you.
Add scheduled release dates for your key series to your own calendar. When the release arrives, you are ready. Calendars are occasionally changed, so keep the calendar feed running rather than copying dates once; a postponed release is itself worth knowing about.
Step 3: Follow publication and release pages
The publications or latest releases page announces each release as it happens, usually with a headline summarizing the result and a link to the full bulletin and data tables. This is the feed that tells you data is out. Many statistics offices offer feeds per topic, for example labour market, prices or trade. Use topic feeds where they exist, since they are already filtered.
Where no feed exists, create one from the release list page. Check the preview: each item should be one release, with its headline and a link to the release page. Headlines of statistical releases often contain the key result, such as a rate or a percentage change, which lets you see the main number without opening the bulletin.
Step 4: Watch open data portals
Open data portals host many datasets from many publishers. To follow what matters to you:
- Filter the portal’s dataset list by publisher, topic or tag, and sort by newest or recently updated.
- Check whether the filtered list has a feed; many open data platforms provide feeds of datasets or activity.
- If not, and the filtered list has a stable address, create a feed from it.
- For individual datasets you depend on, check whether the portal offers notifications of updates.
Note the difference between new datasets and updated ones. A new dataset appears as a new item; an existing dataset refreshed with new data may keep the same link and not appear as new in a feed. For critical datasets, use the portal’s update notifications or check the dataset’s last-modified information directly.
Step 5: Filter and route
Merge your statistics sources into one or two feeds, for example “scheduled releases” and “new data”. Filter broad sources for your indicators and topics, using the names statisticians use: “consumer price index”, “labour force survey”, “industrial production”, and so on. Route the “new data” feed to whoever updates dashboards, models or reports, so they can act on release day.
Keep a short list of the series you follow, with their official names, publishers, release frequency and the page where each appears. When a colleague takes over, or when a statistics office reorganizes its website, that list makes it quick to rebuild the feeds and check nothing was lost.
A worked example
An economist at a mid-sized consultancy writes a monthly market briefing for clients in construction. She depends on building permits, construction output, producer prices for materials, employment in construction and mortgage lending data, published by the national statistics office, the central bank and a ministry. The statistics office offers topic feeds for construction and prices; the central bank has a releases feed; the ministry’s statistics section has no feed, so she generates one from its publications list. She also follows the release calendar, filtered for her five series, and a city open data portal’s list of datasets from the planning department.
Scheduled dates go into her calendar at the start of each month. On release days, the “new data” feed tells her the moment each release is listed, and she updates her charts the same afternoon. When the planning department publishes a new dataset of approved housing projects, she spots it within a day and uses it in the next briefing, weeks before competitors mention it.
Common mistakes
- Following only the home page news. Statistics offices publish many releases that never reach the front page.
- Missing revisions. Official statistics are often revised. Release bulletins usually mention revisions; read them, not just the headline number.
- Assuming updated datasets show as new items. They often do not. Use dataset notifications for critical data.
- Using everyday words in filters. Official titles use technical names. Filter with those.
- Ignoring release times. Many releases appear at a fixed time. If speed matters, check the feed or the release page at that time.
- Not checking feeds after site changes. Statistics offices modernize their websites every few years. Confirm that each feed still shows recent releases.
How Feeds helps
Feeds turns release calendars, publication lists and filtered dataset lists into RSS when they have no feed, and uses existing feeds when they do, with a preview before anything is created. You can merge sources from several bodies into one feed and keep only items with your indicator names, with duplicates removed automatically. Feeds refresh on their own; for releases at a fixed time where minutes matter, also check the official release page directly. Plan details are on the pricing page.
Related reading
- How to Get Alerts When a Website Publishes New Reports or PDFs
- How to Track Government and Regulator Updates with RSS
- How to Follow Academic Journals and Research with RSS Alerts
The bottom line
Official statistics and open data are published on predictable pages: calendars, release lists and dataset lists. Follow them as feeds, filter with the technical names of the series you use, and plan around scheduled release dates. Remember that updated datasets may not appear as new feed items, and use portal notifications for data you cannot afford to miss.
SSS
Do statistics offices offer RSS feeds?
Many do, often for all releases and for individual topics. Check the release or publications pages and the site’s subscription options for feed links.
How can I know when a statistic will be published?
Follow the statistics office’s release calendar, which lists upcoming publications with dates. Add the dates for your key series to your own calendar.
Can I get alerts for new datasets on an open data portal?
Yes, if the portal offers dataset feeds or if you create a feed from a filtered, date-sorted dataset list. Filter by publisher or topic to keep it relevant.
Will a feed tell me when an existing dataset is updated?
Often not, because the dataset keeps the same link. Use the portal’s update notifications or check the dataset’s modification date for critical data.
How should I filter statistics feeds?
Use the official names of the series and topics you use, such as consumer price index or labour force survey, since release titles use technical terms.