ENEnglish
 LTLietuviškai
 DEDeutsch
 FRFrançais
 RUРусский
 ESEspañol
 PLPolski
 ITItaliano
 UKУкраїнська
 CSČeština
 PTPortuguês
 JA日本語
JA日本語 LVLatviešu valoda
 ETEesti
 HUMagyar
 IDBahasa Indonesia
 TRTürkçe
 HIहिन्दी
 ELΕλληνικά
 ARالعربية
 THไทย
THไทย VITiếng Việt
 RORomână
 MSBahasa Melayu
 BNবাংলা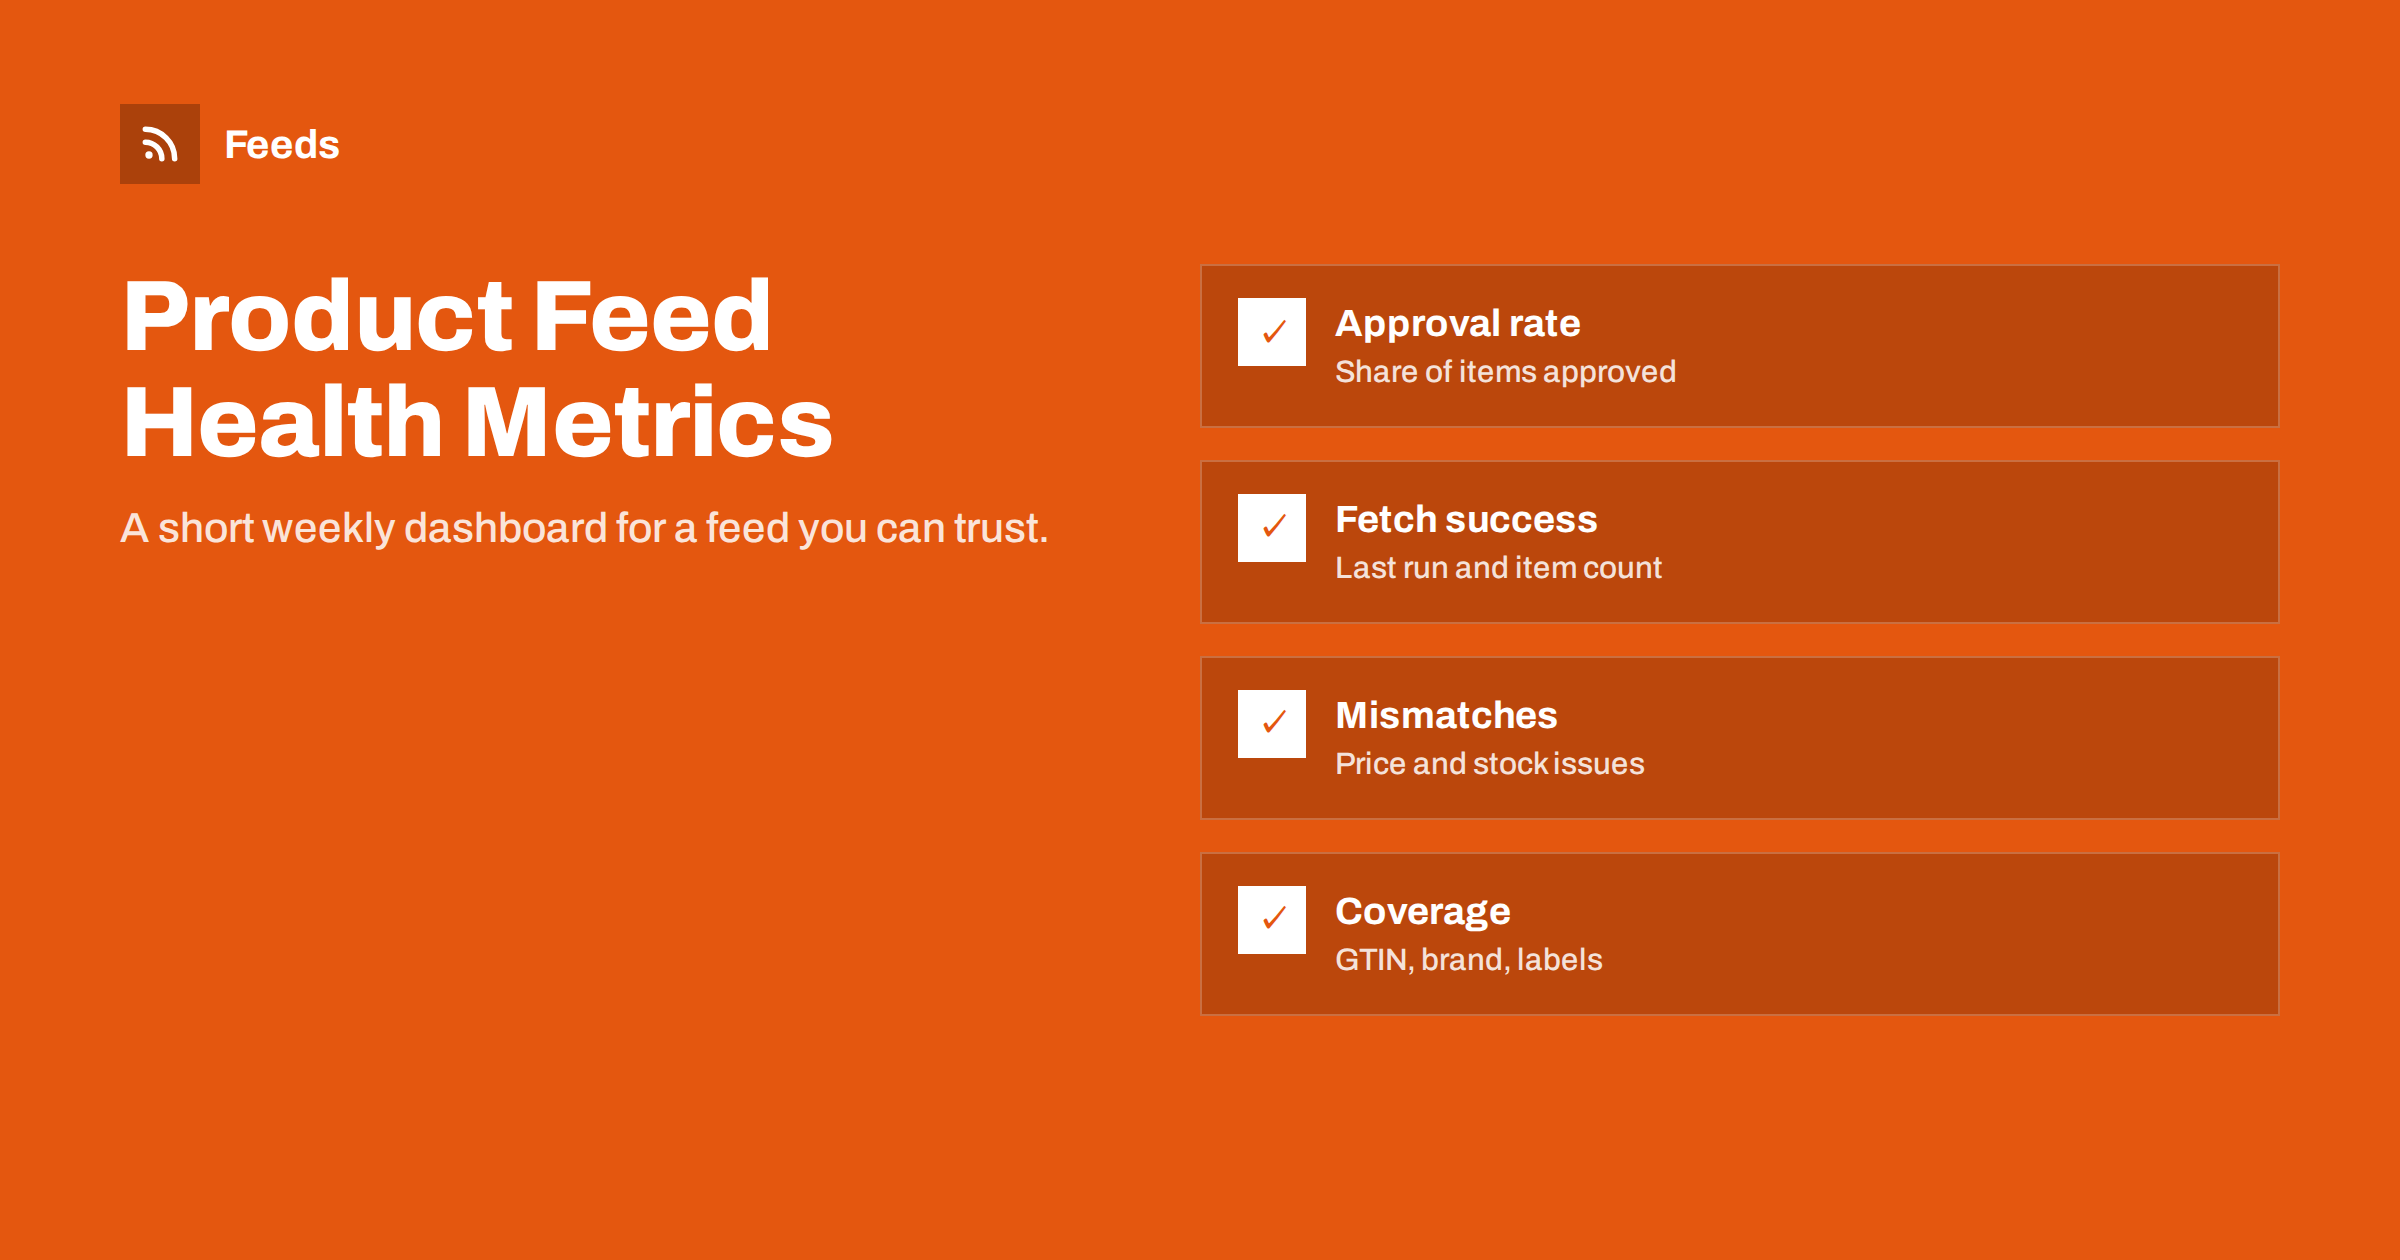
Short answer: A healthy product feed can be monitored with a handful of weekly metrics: the share of items approved in each platform, whether the last fetches succeeded and processed the expected number of items, the number of price and availability mismatches, coverage of key attributes such as GTIN, brand and product_type, and product-level signals such as items with impressions but no clicks. Track them in one place, compare week over week, and investigate any sudden change.
Why measure feed health separately
Campaign reports tell you how ads perform. They do not tell you why a product is missing, why a category suddenly lost impressions, or why costs rose while traffic stayed flat. Many of those answers sit in the feed: disapproved items, stale prices, missing identifiers or a data source that failed to fetch.
Feed problems also tend to develop slowly. A few items get disapproved one week, a few more the next, and after a couple of months a noticeable share of the catalog is not showing. Without a simple set of metrics tracked over time, the decline is only noticed when someone asks why sales from Shopping are down.
A weekly feed health check takes around fifteen minutes once set up. It turns feed quality from something discussed only during crises into a normal part of running the store.
The metrics below are deliberately simple. They can be read from platform reports and the feed file without special tools, and each one points to a specific type of problem when it changes.
Metric 1: approval rate
The approval rate is the share of submitted items that are approved and eligible to show, per platform and per country. Merchant Center shows item status counts, and Commerce Manager shows items with issues.
- Track it weekly and note the trend, not just the value.
- Break it down by destination: an item can be approved for free listings but limited for ads.
- Investigate any drop of more than a few percentage points; it usually has one cause.
There is no universal target, but for a well-maintained store, the large majority of items should be approved, and the rest should be explained, for example by deliberate policy restrictions.
When the approval rate drops, open the list of issues and sort by the number of affected items. The top issue usually explains most of the drop, and fixing it at its source restores most of the approvals within a few fetches.
Metric 2: fetch success and item counts
For each data source, record whether the last scheduled fetch succeeded, when it ran and how many items were processed. Compare the processed count with the number of products you expect to be in the feed.
- A failed fetch means the platform is working with older data.
- A successful fetch with far fewer items than expected usually means parsing errors or an overly broad exclusion rule.
- A sudden jump in items can mean duplicates or products that should have been excluded.
This is the metric that catches silent failures, such as a firewall rule added during maintenance that blocks the platform’s fetcher.
If you run several feeds, for example one per country or one per platform, track each separately. A problem in one market is easy to miss in a combined total, especially when the home market is much larger.
Metric 3: mismatches
Price and availability mismatches are the most common signs that the feed and the website are out of sync. Track the number of items with mismatch issues each week, separately for price and availability. If you use automatic item updates, also note how many items are being corrected that way; a high number means the feed itself is stale or wrong.
Mismatches that spike around sales or restocks point to refresh timing. Persistent mismatches on the same products point to mapping problems, such as tax or variant links.
It is worth keeping a short list of the issue types you have seen before and what caused them. When the same issue returns, the list points straight to the likely cause and the fix that worked last time.
Metric 4: attribute coverage
Coverage metrics show how complete your data is, which affects matching and control even when items are approved:
| Attribute | Why coverage matters | Typical goal |
|---|---|---|
| gtin (where products have barcodes) | Matching and eligibility for product-level features | Nearly all branded products |
| brand | Required for most new products | All applicable items |
| product_type | Campaign structure and reporting | All items |
| custom labels in use | Budget control by business rules | All items, per label plan |
| additional images | Richer listings | Top products at least |
Measure coverage from the feed file itself, for example by counting empty values per column. The trend matters more than the exact number: coverage should rise as new products come in with complete data.
Coverage is also a useful way to measure progress on data projects. If you start filling missing GTINs from supplier files, the coverage figure shows how far the project has come and when it is done.
Metric 5: product-level performance signals
Some feed problems show up only in performance data. A few simple product-level views help:
- Items with no impressions over several weeks, which may have weak titles, missing identifiers or limited eligibility.
- Items with impressions but very few clicks, which may have unattractive images, uncompetitive prices or unclear titles.
- Items with clicks but no conversions, which may have landing page, stock or price problems.
These views do not diagnose problems by themselves, but they tell you where to look first. Start with the products that have the most spend or the most impressions.
Remember that performance also depends on factors outside the feed, such as bids, budgets, seasonality and competitors. Use these views to find candidates for investigation, and confirm a feed cause before changing data.
Building a simple weekly routine
- Record approval rate and item counts per platform and country.
- Check the last fetch status for every data source.
- Note the number of mismatch issues and any new issue types.
- Update coverage figures from the latest feed file.
- Review the product-level views for the top-spending products.
- Write down any actions taken and who owns them.
A spreadsheet with one row per week is enough. The value comes from comparing weeks, not from sophisticated tooling. Over time, the sheet also becomes a history that explains past performance changes.
During promotions or after major store changes, run the routine daily instead of weekly until the numbers settle back to their usual range.
Reading the numbers: what changes usually mean
Metrics are only useful if you know how to interpret them. Over time, a few patterns repeat in almost every store:
- Approval rate drops suddenly, item count unchanged: usually a website change, such as a theme update affecting prices in structured data, a new pop-up blocking pages, or a policy review.
- Item count drops, approval rate unchanged: usually the feed itself, such as an exclusion rule, a parsing error or a partial file.
- Mismatches rise around specific dates: promotions, restocks or price updates happening faster than the feed refreshes.
- Coverage falls slowly: new products being added without identifiers or labels; fix the product creation process rather than individual items.
- Impressions fall while approvals stay high: competition, bids or seasonality rather than feed quality, although weak titles can contribute.
When a metric changes, look at what else changed that week: website releases, new plugins, catalog imports, campaign edits. A simple change log next to the metrics sheet makes these connections obvious. Most feed incidents are explained by a change someone made a few days earlier, and the log turns hours of detective work into minutes.
Share the key numbers with whoever makes decisions about the store. A single line in a weekly update, such as the approval rate and any open issues, keeps feed quality visible without requiring anyone else to learn Merchant Center.
How Feeds helps
Feeds generates product feeds from WooCommerce, Shopify or a CSV link and refreshes them automatically, which keeps fetch and mismatch metrics stable. On paid plans, Feeds sends an alert if a feed stops finding items. The Google product XML output works with Merchant Center and Meta, and rules skip out-of-stock products, rewrite titles and adjust prices. See the pricing page for plans.
Related reading
- Merchant Center Disapproved Products: Causes and Fixes
- 12 Product Feed Mistakes That Quietly Cost You Sales
- Product Feed URL: Hosting, Access and Keeping It Reliable
The bottom line
Monitor five things weekly: approval rate, fetch success and item counts, mismatches, attribute coverage and product-level signals. Track them over time in a simple sheet, investigate sudden changes, and record actions. A fifteen-minute routine catches most feed problems long before they show up as lost sales.
FAQ
What is a good approval rate for a product feed?
There is no universal number, but most items should be approved in a well-maintained store, with remaining issues explained and tracked.
How can I tell if my feed stopped updating?
Check the data source’s fetch history for the last successful run and the number of items processed. Failed or missing runs mean old data.
Why do item counts drop suddenly?
Usually because of parsing errors in the file or an exclusion rule that matches more products than intended after a store change.
Which coverage metric matters most?
For branded products, GTIN coverage. For campaign control, product_type and custom labels. Both affect results even when items are approved.
Do I need special software to monitor feed health?
No. Platform reports and a weekly spreadsheet are enough for most stores. Consistency matters more than tools.