ENEnglish
 LTLietuviškai
 DEDeutsch
 FRFrançais
 RUРусский
 ESEspañol
 PLPolski
 ITItaliano
 UKУкраїнська
 CSČeština
 PTPortuguês
 JA日本語
JA日本語 LVLatviešu valoda
 ETEesti
 HUMagyar
 IDBahasa Indonesia
 TRTürkçe
 HIहिन्दी
 ELΕλληνικά
 ARالعربية
 THไทย
THไทย VITiếng Việt
 RORomână
 MSBahasa Melayu
 BNবাংলা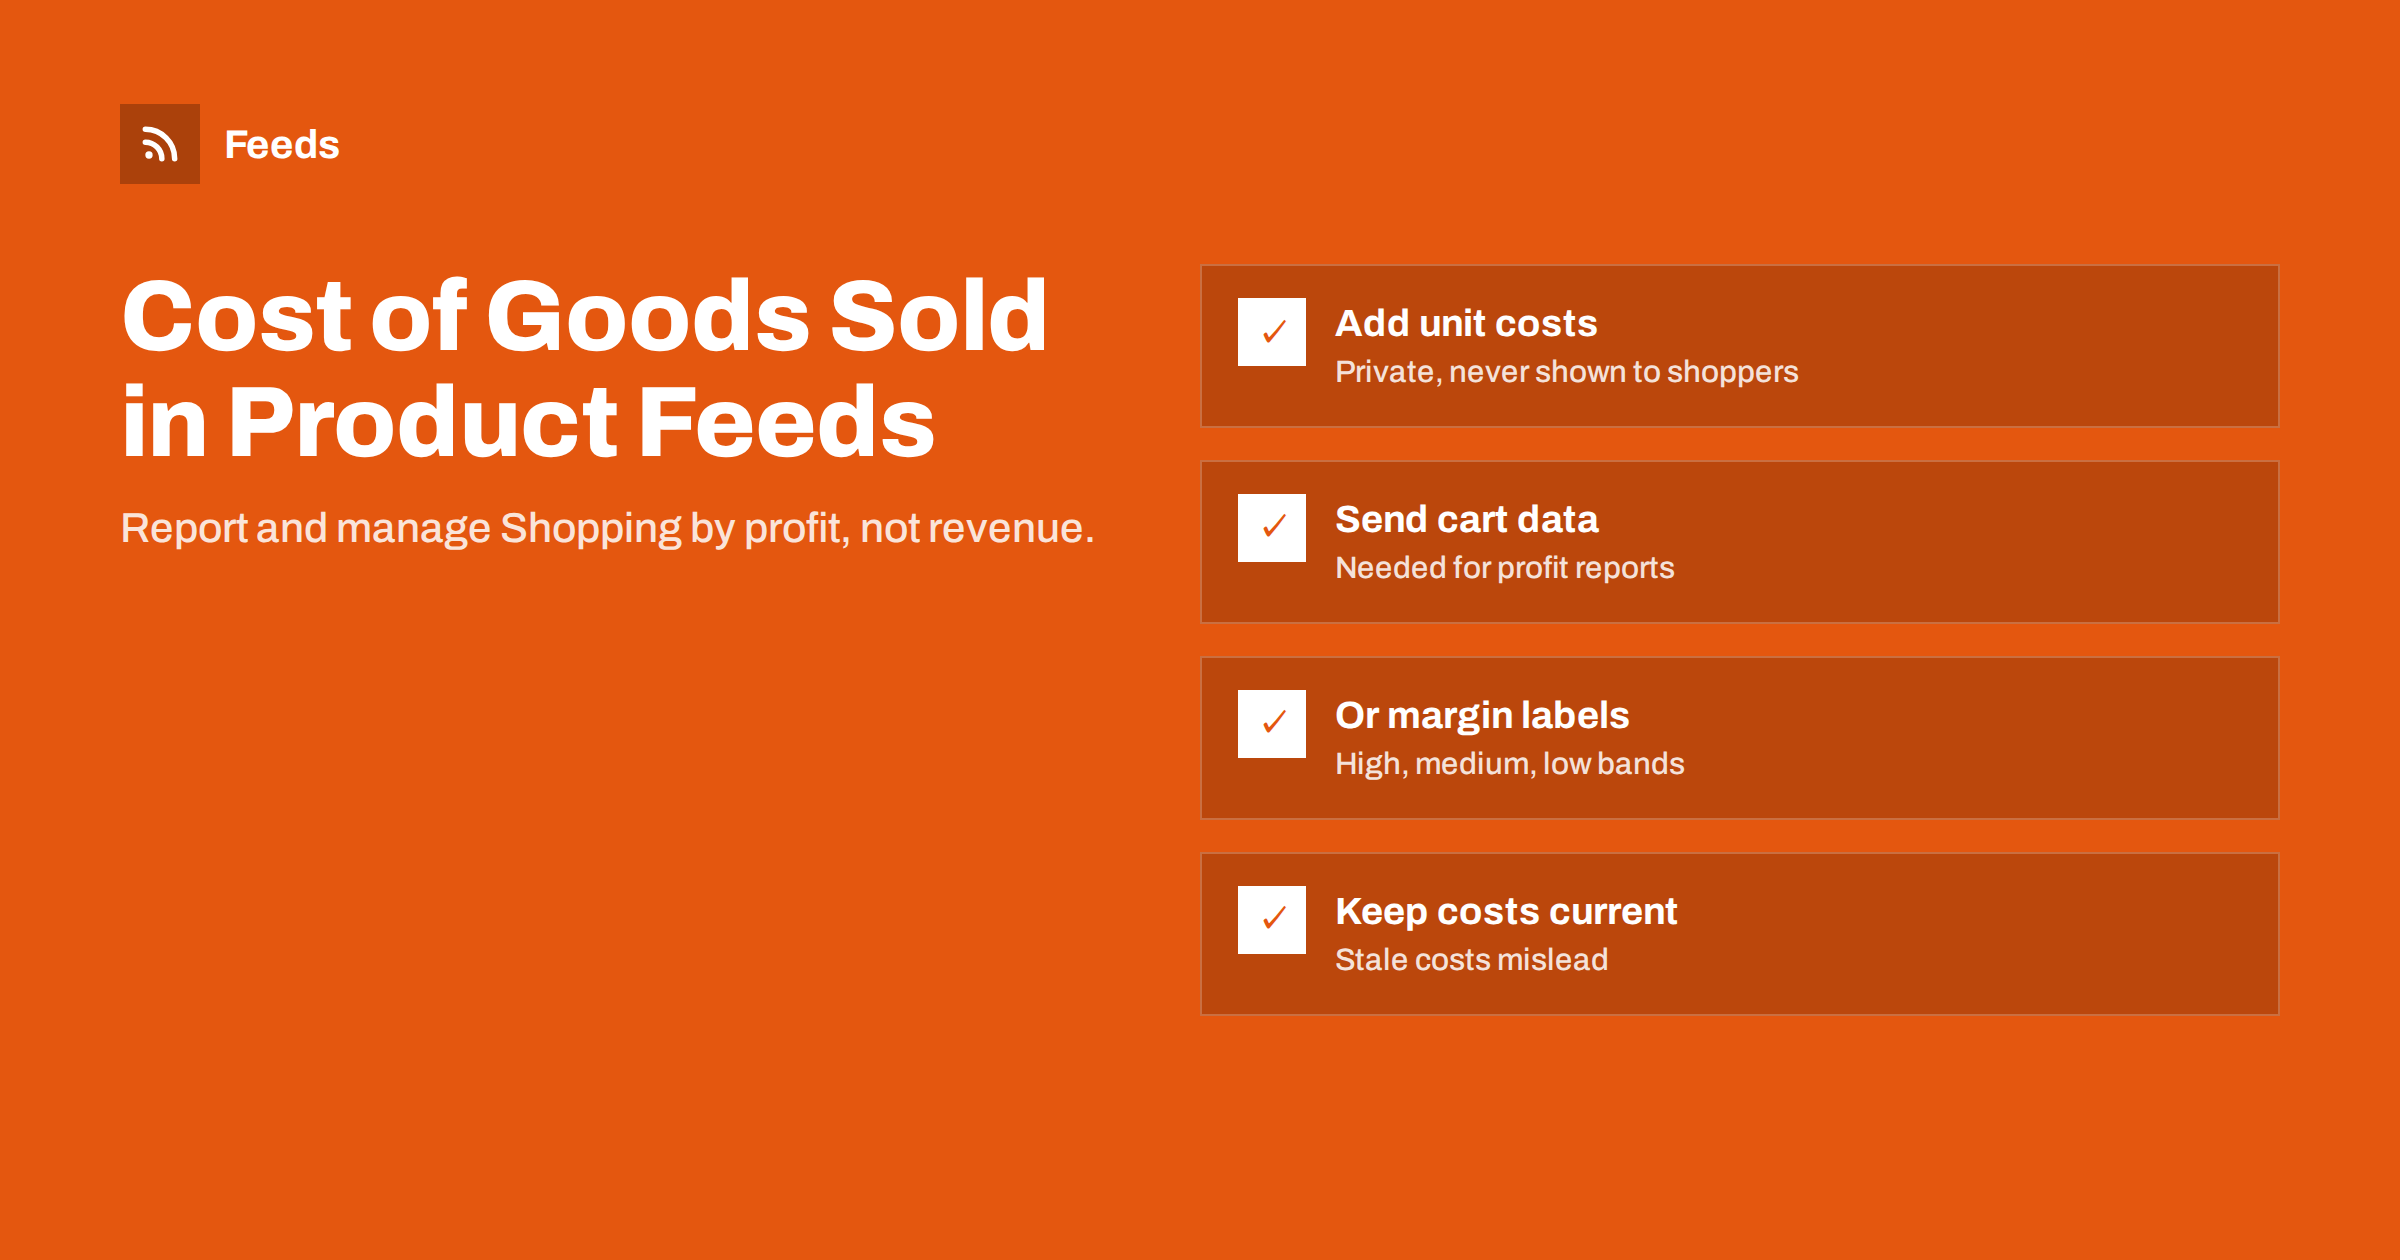
Short answer: cost_of_goods_sold is an optional product feed attribute in Google Merchant Center that tells Google Ads what each product costs you. Combined with conversion tracking that includes cart data, it lets Google Ads report gross profit per product and campaign, not just revenue. It is never shown to shoppers. If you cannot share costs, margin buckets in custom labels are a simpler alternative that still lets you manage campaigns by profitability.
Why revenue is the wrong number to optimise
Shopping campaigns are usually judged by return on ad spend: revenue divided by cost. That works when every product has a similar margin. In most stores it does not. A product that sells for 100 with a 60 percent margin and one that sells for 100 with a 10 percent margin look identical in revenue reports, but one earns six times as much gross profit as the other.
When campaigns optimise for revenue, they happily spend budget on high-priced, low-margin products, because those produce impressive revenue numbers. Profit can fall while reports look healthy. Adding cost data to the feed is how you make the difference visible.
What cost_of_goods_sold is
The cost_of_goods_sold attribute holds the cost of a product to your business, in the same format as a price: a number and a currency, for example 23.50 EUR. It usually means what you paid for the product, or what it cost to make, per unit. Some businesses include inbound shipping or packaging; the important thing is to be consistent.
Key points:
- It is optional. Products are not disapproved without it. It sits among the optional attributes described in Google product feed attributes.
- It is private. Shoppers never see it. It is used for reporting inside Google Ads.
- It works per product. Each item, including each variant, can have its own cost.
- It needs the right conversion setup. Gross profit reporting depends on conversion tracking that sends cart data, meaning which products were in each order.
What you gain with cost data
With cost data in the feed and cart data in your conversions, Google Ads can calculate revenue, cost of goods sold and gross profit for the products actually sold, and show them in reports. That opens up several practical improvements:
- See which campaigns really make money. A campaign with a modest return on ad spend may earn more profit than one with a high return on low-margin products.
- Spot products that sell at a loss after ad costs. High revenue and thin margin is a common trap.
- Understand basket effects. Cart data shows which products sold after a click on a different product, which can change how you value some advertised items.
- Prepare for profit-oriented bidding. Once you trust your profit data, you can explore bidding and targets based on profit rather than revenue. Test cautiously and check the current options in Google Ads, which change over time.
If you run Performance Max, cost data adds useful context to results that are otherwise reported mostly in revenue; see what matters in a feed for Performance Max.
Setting it up, step by step
- Collect costs. Export unit costs from your inventory, accounting or ERP system, one row per product ID or SKU used in your feed.
- Choose where to add them. If your feed tool can include a cost field from your store, use it. Otherwise, add costs through a supplemental feed in Merchant Center, which matches rows to your main feed by product ID.
- Use the right format. Number plus currency, in the same currency as the product price.
- Set up conversions with cart data. Your purchase conversion must send the items in each order. Many e-commerce platforms and tag setups support this; check your platform’s documentation.
- Verify in Merchant Center. Confirm the attribute is received for your products and that item IDs match.
- Wait for data, then read reports. Gross profit reporting builds up as new conversions come in; allow a few weeks before drawing conclusions.
The simpler alternative: margin labels
Not every business wants to share costs with an advertising platform, and not every store has reliable cost data per product. Custom labels offer a coarser but useful alternative. Group products into margin bands and put the band in a label:
| Approach | What it gives you | Effort | Shares costs? |
|---|---|---|---|
| cost_of_goods_sold plus cart data | Gross profit reporting per product and campaign | Medium: cost data and conversion setup | Yes, privately with Google Ads |
| Margin bands in custom labels | Campaigns and bids organised by margin level | Low: one label per product | No, only the band |
| Excluding low-margin products | Stops spend on unprofitable items | Low | No |
| Revenue only | Simple, but blind to margin | None | No |
Margin labels such as “high”, “medium” and “low” let you split campaigns, set different targets per group and see performance by margin band. The mechanics are covered in custom labels in product feeds. Some stores go further and stop advertising the lowest-margin items altogether, as described in which products to exclude from your feed.
A simple illustration
The effect is easiest to see with round, made-up numbers. Imagine two campaigns that each spend 1,000 on ads in a month:
- Campaign A sells premium headphones. It brings 8,000 in revenue, a return on ad spend of 8. The products cost 6,400, so gross profit after ad spend is 8,000 minus 6,400 minus 1,000, which is 600.
- Campaign B sells own-brand accessories. It brings 4,000 in revenue, a return on ad spend of only 4. The products cost 1,200, so gross profit after ad spend is 4,000 minus 1,200 minus 1,000, which is 1,800.
Judged by revenue, Campaign A looks twice as good and would get more budget. Judged by profit, Campaign B earns three times as much. Real accounts are messier, but this pattern, high revenue on thin margins and modest revenue on healthy margins, is common in stores that mix branded and own-brand products. Cost data or margin labels are what make it visible in your reports.
Common mistakes
- Stale costs. Supplier prices change. A cost file uploaded once and forgotten slowly makes profit reports wrong. Update costs whenever you update purchase prices, or on a monthly schedule.
- Wrong currency. Costs in a different currency from prices produce nonsense margins.
- Mismatched IDs. Supplemental data only applies when IDs match exactly, including variant IDs.
- Costs without cart data. Without conversion data that includes products, cost data cannot be turned into profit reports.
- Mixing definitions. Including shipping in some costs and not others makes products incomparable. Decide on one definition and document it.
- Changing strategy too fast. Let profit data accumulate before you restructure campaigns around it.
Is it worth it for a small store?
It depends on your margins and your ad spend. If margins are similar across your range, revenue-based reporting is a fair approximation, and the extra setup may not be worth it. If margins vary widely, for example between own-brand products and resold branded goods, or between accessories and main products, cost data or at least margin labels can change your decisions noticeably. A reasonable path for small stores is to start with three margin labels, which takes an afternoon, and add full cost data once ad spend grows.
Whatever you choose, keep an eye on the basics as well; the weekly checks in product feed health metrics matter more than any advanced attribute if products are disapproved or out of date.
How Feeds fits in
Feeds builds the core Google Merchant Center and Meta product feed straight from a WooCommerce or Shopify store, or from a CSV link, with id, title, link, image, price, availability and brand. It lets you skip out-of-stock products, rewrite titles and adjust prices. Cost data, where you use it, is typically added on top through a supplemental feed in Merchant Center that matches on the same product IDs, so your main feed stays simple. See the pricing page for plans and product limits.
Related reading
- Product feed glossary: key terms every store should know
- Price rules in product feeds: when and how to adjust prices
- Product feed management for agencies: many clients, one process
The bottom line
Revenue hides the difference between profitable and unprofitable products. The cost_of_goods_sold attribute, combined with conversion tracking that includes cart data, lets Google Ads report gross profit per product and campaign without showing anything to shoppers. If sharing costs is not an option, margin bands in custom labels deliver much of the benefit with far less effort. Keep costs current, IDs matched and definitions consistent, and let data accumulate before changing strategy.
SSS
What is cost_of_goods_sold in Google Merchant Center?
It is an optional product attribute that records what a product costs your business. Google Ads uses it, together with conversion data that includes cart contents, to report gross profit. It is not shown to shoppers.
Is cost_of_goods_sold required?
No. Products are approved without it. It only matters if you want profit reporting in Google Ads.
Do I need conversions with cart data for profit reporting?
Yes. Gross profit is calculated from the products actually sold, so your purchase conversions must send which items were in each order, alongside cost data in the feed.
Can I add cost data without changing my main feed?
Yes. A supplemental feed in Merchant Center can add cost_of_goods_sold values matched to your main feed by product ID, leaving the main feed unchanged.
What if I do not want to share product costs with Google?
Use custom labels with margin bands such as high, medium and low instead. You can then organise campaigns and targets by margin level without sharing exact costs.